Simple Network Connectivity Monitor
Constrained Design
While there are a number of ways to solve problems like this, I intentionally constrained myself to a set of solutions that did NOT require me opening firewall ports to my network. Additionally, there should be no "server-side" component that would require deployment of additional resources (if possible). While these constraints are arbitrary, I find it a good exercise for keeping my problem solving chops up.
To that end, I came up with the following set of specifications:
- Give a visual status that my home workstation(s) are up and running (and therefore my router as well).
- Do NOT require any inbound access at all.
- Must be quick to develop and deploy
- Must be visibile from cell phone / laptop / etc.
- Do not require server-side infra deployment (if possible)
Given the above specifications, the approach I came up with is pretty simple:
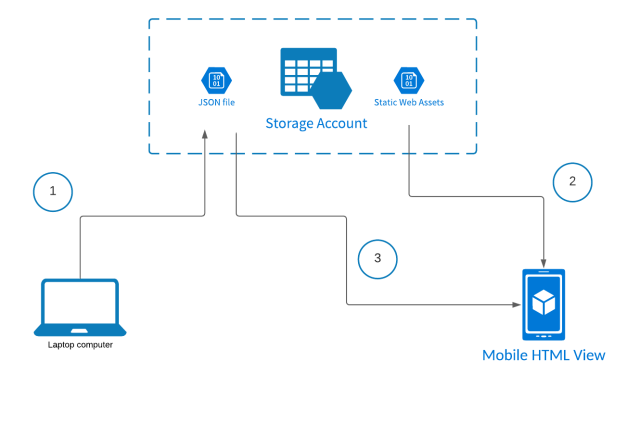
The basic idea is as follows:
- On one of my laptops / workstations (step "1" in the diagram) executes a simple shell script that does the following:
- Create a small JSON file indicating the current local date/time in ISO-8601 format.
- Upload this JSON file to an Azure storage account container
- Automate this process via CRON to run every minute.
- To setup visualization, do the following:
- Create a small, single HTML page with a bit of vanilla JS, hosted from the $web container on Azure storage (step "2" in the diagram)
- The JS on the page will read the uploaded JSON file from the home machine (step "3" in the diagram)
- The JSON file will be parsed to update/present a simple animation indicating the current status of the home network as follows:
- If it's been updated within the last minute, it's assumed up.
- If there was been no update in 2 minutes, it's assumed down.
That's it - I think it's about as simple as I could make it.
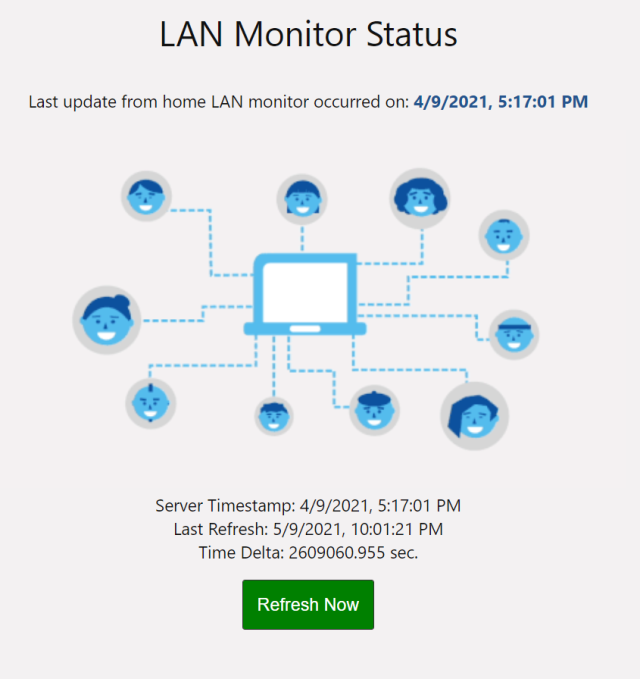
Running the Monitor
Full details for setting up the connection monitor are on the GitHub repo - but once configured and running, you should see a visual indication of the network connection status as shown below:
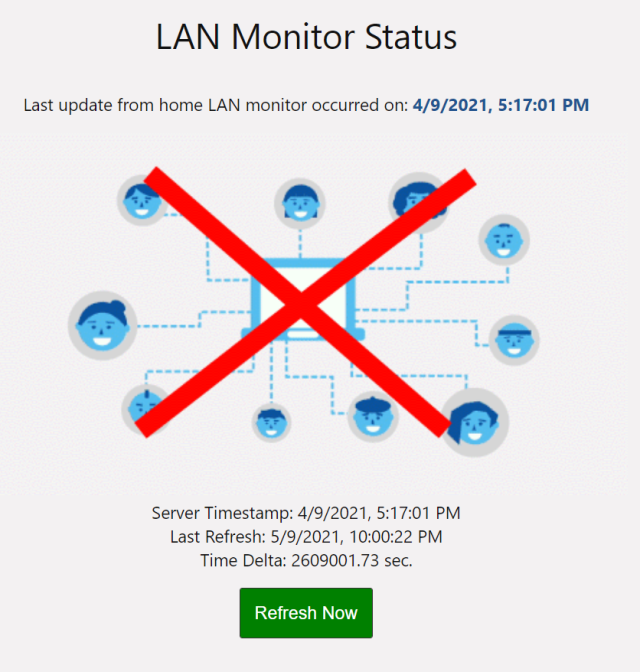
If the monitor is unable to keep the JSON file update for around ~2 mins, you should see the following status indication:
Next Steps
Obivously, this same technique is used frequently when enabling inbound private network access is either not desired or not possible. This approach is also applicable to many other pieces of data than just network status - metrics such as CPU, memory usage, temperature, etc. are all candidates for "push style" reporting.
Finally, in the sprit of the #30MintueDrill, there are many areas that could use some cleanup - error handling, formatting cleanup, even testing. I'll contiue to fix up and submit issues as I find things, but PR's are always accepted :-).